1BRC in Java: from 204s to 13.5s, one profile at a time
Published:
This post is my optimization log for the One Billion Row Challenge (1BRC) in Java. I took a plain Files.lines + HashMap solution through 8 passes, and each pass started from what the previous flame graph showed.
- 1B rows (14 GB): 204.6s → 13.5s
- 100M rows (1.4 GB): 21.0s → 0.5s
- Code: lehoangtran289/1brc-java
0. The challenge
The input is a text file with one measurement per line, in the format <station name>;<temperature>. The temperature always has exactly one fractional digit:
Hamburg;12.0
Bulawayo;8.9
Palembang;38.8
St. John's;15.2
Istanbul;23.0
The program has to compute the min, mean and max temperature for each station and print them sorted by station name:
{Abha=-23.0/18.0/59.2, Abidjan=-16.2/26.0/67.3, Abéché=-10.0/29.4/69.0, ...}
The rules that matter for the tricks below: station names are 1 to 100 bytes of UTF-8, there are at most 10,000 unique stations (the generated data has about 413), and temperatures range from -99.9 to 99.9.
1. Setup
| Machine | Apple M1 Pro: 8 cores (6 performance + 2 efficiency), 16 GB RAM, macOS |
| JDK | OpenJDK 21 (Temurin) |
| Dataset | measurements_100M.txt: 100M rows, 1.4 GB (stays in page cache) |
| Profiler | IntelliJ IDEA Profiler (JFR), CPU Time flame graph |
| Timing | hyperfine --warmup 1 --runs 10 |
A few notes on the numbers:
- Times marked † are the profiler’s total CPU time. I used those until I switched to hyperfine, and from Pass 3 on every 100M time is hyperfine wall time. The two are different measurements, so only compare times measured the same way.
- The 1B times don’t scale 10× from 100M. Pass 6 took 1.7s on 100M, which would predict 17s for 1B, but the 1B run took 43.9s. The 14 GB file likely doesn’t stay in page cache next to the JVM and the IDE on 16 GB of RAM, so the 1B runs include disk reads.
2. Results
| Pass | Change | 100M | 1B |
|---|---|---|---|
| 1 | Baseline: Files.lines + split + parseDouble + HashMap<String> | 21.0s† | 204.6s |
| 2 | mmap + parse bytes by hand | 7.0s† | 83.2s |
| 3 | byte[] key instead of String | 2.98s | 62.6s |
| 4 | Custom open-addressing hash table | 2.65s | 59.8s |
| 5 | Read and compare the name 8 bytes at a time as long | 1.8s | 46.6s |
| 6 | Branch-free temperature parsing, first 2 name words as fields | 1.7s | 43.9s |
| 7 | Drop the per-read bound check | ~1.7s (no change) | 42.2s |
| 8 | Parallel chunks, one table per chunk | 0.5s | 13.5s |
Each pass below starts from what the previous profile showed, then describes the idea it led to and the result. The flame graph at the end of a pass is the evidence for the next one.
Pass 1: Baseline (21.0s†)
The baseline is the most obvious Java you could write: read each line with Files.lines, split it on ;, parse the temperature with Double.parseDouble and aggregate into a HashMap. A TreeMap sorts the output at the end.
Map<String, Stats> stats = new HashMap<>();

try (Stream<String> lines = Files.lines(Path.of(FILE))) {
    lines.forEach(line -> {
        String[] parts = line.split(";");
        String station = parts[0];
        double measurement = Double.parseDouble(parts[1]);

        stats.computeIfAbsent(station, k -> new Stats()).add(measurement);
    });
}

System.out.println(new TreeMap<>(stats));
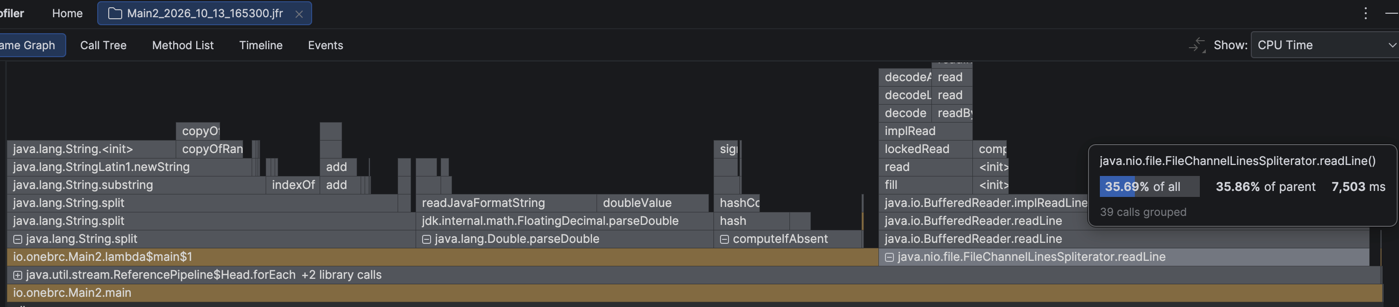
In the profile, readLine takes 36%, String.split about 29%, parseDouble about 21% and the HashMap about 11%.
Pass 2: mmap + parse bytes by hand (21.0s† → 7.0s†)
The three biggest frames in Pass 1, readLine, split and parseDouble, all do the same kind of work. They turn text into objects: a String for every line, then substrings and a String[], then text into a double. The aggregation itself, the HashMap, is only about 11%.
I removed those object-creating steps one at a time and profiled again after each one.
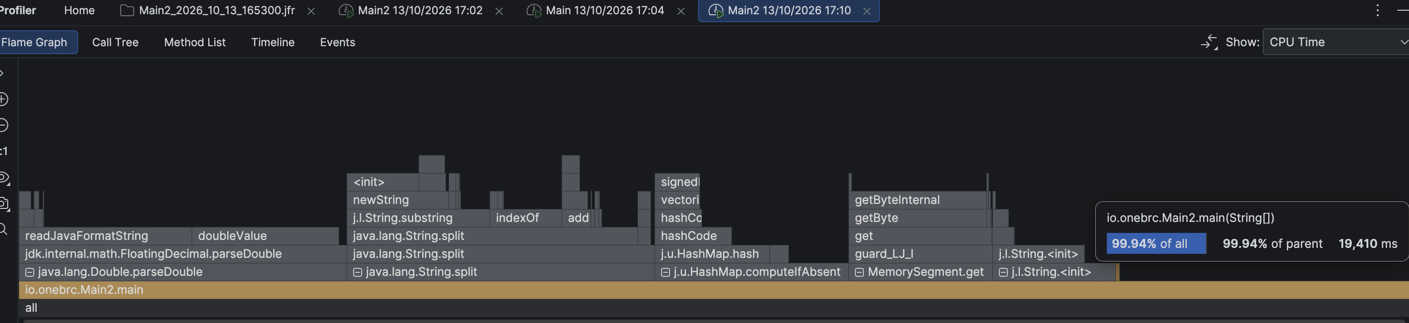
Step 1: replace readLine with mmap. The file is mapped into memory as a MemorySegment (the Foreign Memory API, final in Java 22, preview in 21). The code now scans the mapped bytes for \n itself, but it still does new String for every line. That brought the time down to 19.4s†.
try (FileChannel channel = FileChannel.open(Path.of(FILE), StandardOpenOption.READ)) {
    MemorySegment file = channel.map(FileChannel.MapMode.READ_ONLY, 0, channel.size(), Arena.global());
    // ...
}
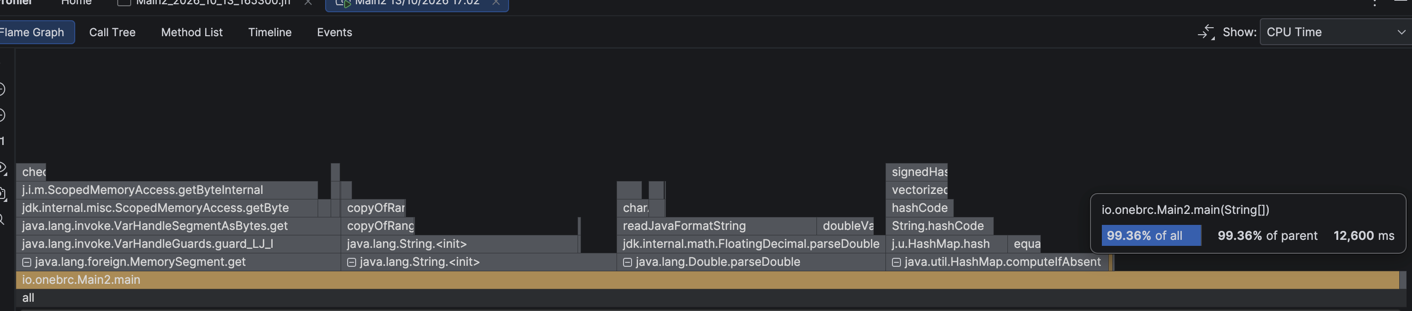
Step 2: find ; in the same byte scan instead of calling split. The name and the temperature were each still turned into a String. That got it to 12.6s†.
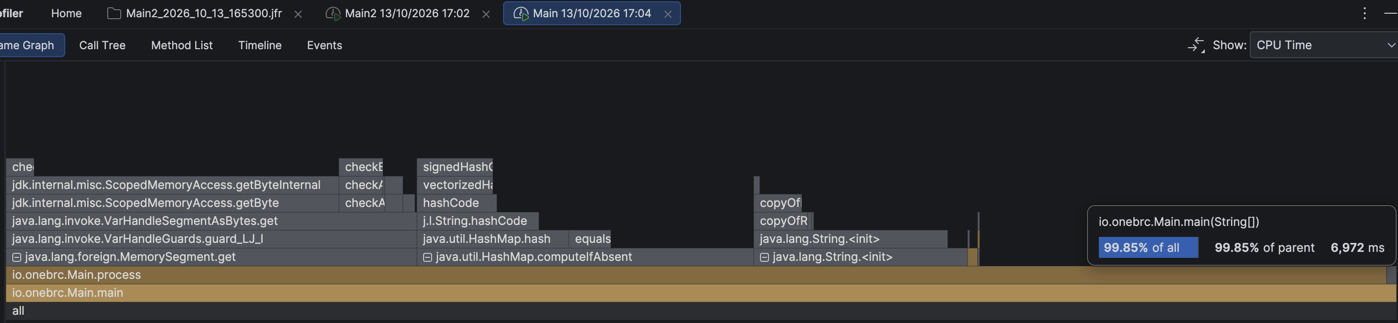
Step 3: replace parseDouble. Since every temperature has exactly one fractional digit, I parse the digits straight into an int of tenths, so -12.3 becomes -123. The stats stay in integers until printing. That reached 7.0s†.
// "-12.3" -> -123
int sign = 1;
currentByte = file.get(JAVA_BYTE, offset++);    // first char
if (currentByte == MINUS) {
    sign = -1;
    currentByte = file.get(JAVA_BYTE, offset++);
}
int temp = toDigit(currentByte);                // first digit
currentByte = file.get(JAVA_BYTE, offset++);
if (currentByte != DOT) {
    temp = temp * 10 + toDigit(currentByte);    // second digit
    offset++;                                   // skip '.'
}
currentByte = file.get(JAVA_BYTE, offset);
temp = temp * 10 + toDigit(currentByte);        // fraction digit
offset += 2;                                    // skip fraction digit & '\n'
int measurement = sign * temp;
Why mmap saved only 2s
The mmap step saved only about 2s, even though readLine had been 7.5s of the profile. The reason is that readLine did three jobs: getting the bytes, finding the \n and building the String. The mmap version still does the last two, which now show up as MemorySegment.get (about 2.6s) and String.<init> (about 2.1s). Copying the file was never the cost. Here is each piece measured in isolation:
| Step | Time |
|---|---|
read() the whole file into a 1 MB buffer (all the copying) | 0.1s |
| mmap: touch one byte per 16 KB page (page faults) | 0.2s |
mmap: byte loop finding \n | 1.9s |
mmap: byte loop + new String per line | 3.5s |
Files.lines (read + decode + readLine + String) | 5.6s |
The lesson: to estimate a saving, you have to subtract all the new frames that still do the old job, and then confirm end to end with hyperfine, not with a single profiling run.
Pass 3: byte[] key instead of String (→ 2.98s)
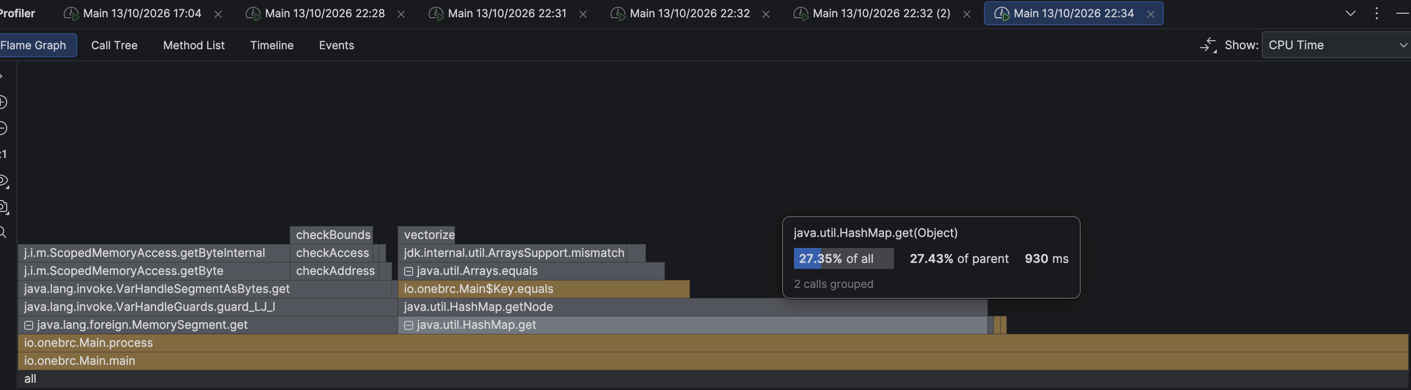
In Pass 2’s profile, HashMap.computeIfAbsent is about 24% (String.hashCode, equals) and String.<init> about 16%. Both costs exist only because the program still builds a String for every line to use as a map key, which then gets hashed and compared.
I switched to using the name bytes as the key. One reusable Key, holding a scratch buffer, the length and a hash computed while scanning, does every lookup. The bytes get copied into a new Key only the first time a station shows up, which happens about 413 times in 100M lines.
This is also where timing moves to hyperfine wall time, so the 2.98s can’t be compared directly with Pass 2’s 7.0s†.
Pass 4: Custom hash table (2.98s → 2.65s)
With the String gone, the map itself is the next cost. In Pass 3’s profile, HashMap.get is 27%, spent in getNode → Key.equals → Arrays.equals. Every lookup goes through several layers (virtual hashCode/equals, node objects), all for a table of only ~413 keys.
I replaced it with my own open-addressing table: 2^14 slots with linear probing, indexed by the precomputed hash. On a probe, it compares the hash and the length first and looks at the bytes only if both match. One Entry holds both the name and the stats, so a lookup returns the thing to update directly.
public Entry getOrInsert(byte[] buffer, int length, int hash) {
    int index = (hash ^ (hash >>> 14)) & MASK;

    while (true) {
        Entry entry = entries[index];

        if (entry == null) { // new station: copy the name only here
            entries[index] = new Entry(Arrays.copyOf(buffer, length), hash);
            return entries[index];
        }

        // cheap checks first, bytes last
        if (entry.hash == hash
                && entry.nameBuffer.length == length
                && Arrays.equals(entry.nameBuffer, 0, length, buffer, 0, length)) {
            return entry;
        }

        index = (index + 1) & MASK; // collision: linear probing
    }
}
With 2^14 slots and ~413 keys, the table is under 3% full, so probe chains stay short.

Pass 5: 8 bytes at a time (2.65s → 1.8s)
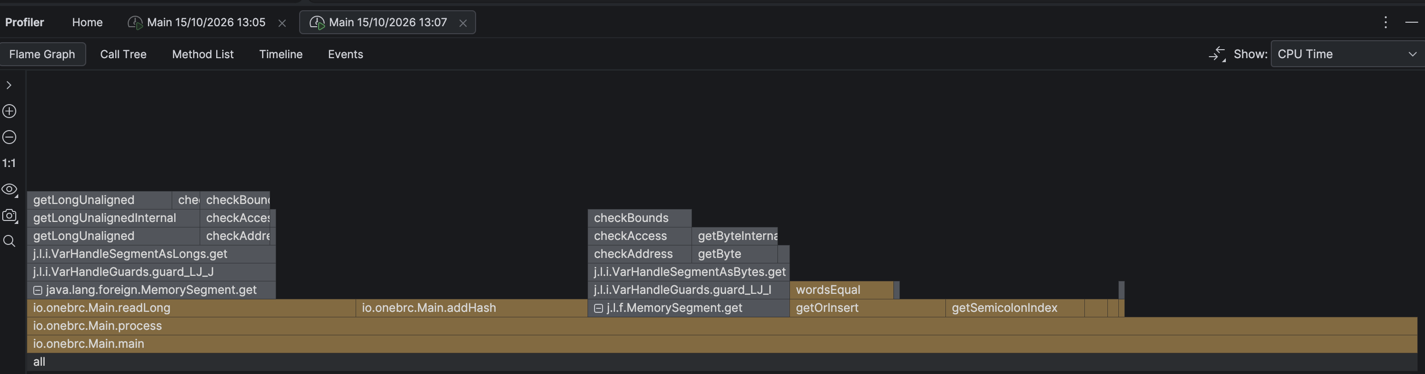
In Pass 4’s profile, about 47% is MemorySegment.get → getByte, which reads one byte per call and checks bounds and liveness on every call. Another 23% is Arrays.equals, comparing names byte by byte.
Both come down to handling one byte at a time, so the fix is to read 8 bytes at once as a little-endian long. To find the ; inside that long without looping over its bytes, I used a SWAR (SIMD Within A Register) bit trick:
private static final long SEMI_PATTERN = 0x3B3B3B3B3B3B3B3BL; // ';' in every byte
private static final long ONES         = 0x0101010101010101L;
private static final long HIGH_BITS    = 0x8080808080808080L;

private static long findSemicolon(long word) {
    long input = word ^ SEMI_PATTERN;            // the ';' byte becomes 0x00
    return (input - ONES) & ~input & HIGH_BITS;  // marks the first 0x00 byte
}
- XOR with
;;;;;;;;turns the;byte into00and every other byte into something non-zero. (x - 0x0101…) & ~x & 0x8080…is the classic “find a zero byte” expression. It sets the high bit of the first00byte.- Because the long is little-endian, the first byte in the file is the lowest byte of the
long, soLong.numberOfTrailingZeros(match) >>> 3gives the index of;(0 to 7).
For example, Hamburg; fits in one long with ; as byte 7, so match is 0x8000000000000000, which has 63 trailing zeros, and 63 >>> 3 = 7.
The name is kept as those long words too: they are XOR’d into the hash as they’re read and compared as a long[] in the table. A typical name now takes 1 or 2 compares instead of about 10.
while (true) {
    word = file.get(LONG_LE, offset);   // read 8 bytes
    match = findSemicolon(word);
    if (match != 0) break;              // ';' is in this word

    words[wordsLength++] = word;
    hash ^= word;
    offset += 8;
}
// keep only the bytes before ';' in the last word
long nameBytes = word & ((match ^ (match - 1)) >>> 8);
Pass 6: Branch-free temperature (1.8s → 1.7s)
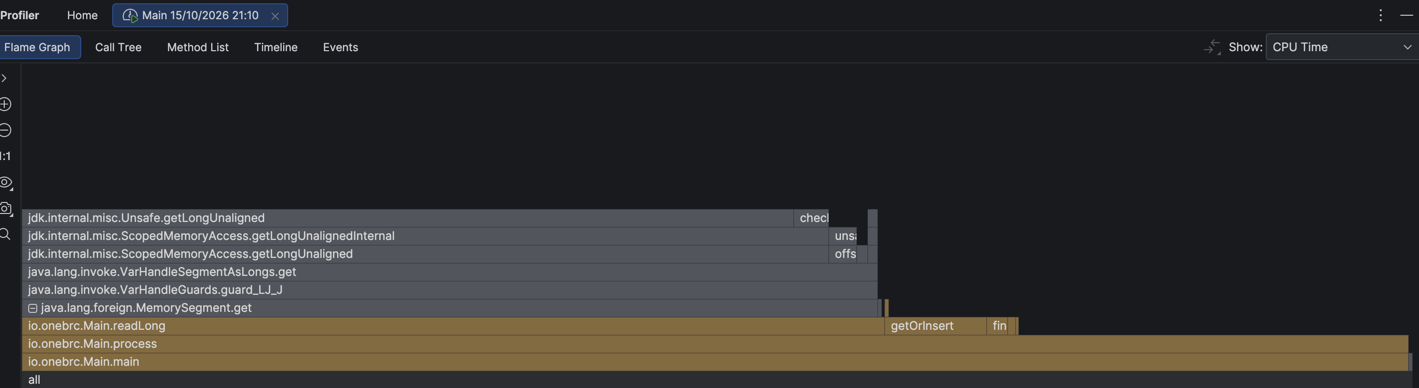
About 14% of Pass 5’s profile is still MemorySegment.get → getByte. That is the temperature, which was still parsed byte by byte, with branches on the sign and the digit count. Both depend on random data, so the branch predictor can’t learn them. On top of that, getOrInsert (about 11%) runs a wordsEqual loop on every lookup.
I made two changes.
The temperature is now read as one long. The 4 possible shapes are X.X, -X.X, XX.X and -XX.X. A bit trick finds the .: ASCII digits (0x30–0x39) have bit 4 set and . (0x2E) doesn’t. Shifts and one multiply then compute the value with no branches. This one is not mine: credit goes to merykitty and royvanrijn from the original challenge.
private static final long DOT_BITS = 0x10101000;

// bit 4 of bytes 1, 2, 3: the one that is 0 is the '.'
// returns 12, 20 or 28
private static int dotPos(long word) {
    return Long.numberOfTrailingZeros(~word & DOT_BITS);
}
The first two name words are now fields on Entry. In the 100M file, about 98% of lines have a station name of 15 bytes or less, so the name and its ; fit in the first two words. Those lookups are two long compares with no loop. Only longer names fall back to comparing the rest of the array.
if (entry.hash == hash
        && entry.word0 == words[0]
        && entry.word1 == words[1]
        && (wordLength <= 2 || wordTailEquals(entry.words, words, wordLength))) {
    return entry;
}
Pass 7: Drop the per-read bound check (~1.7s, no change)
In Pass 6’s profile, about 62% of the samples are in readLong → MemorySegment.get → getLongUnaligned, and readLong checks offset + 7 < fileSize on every read.
A line reads at most 108 bytes past its start, so every line that starts more than 128 bytes before EOF can use a plain file.get. The last ≤128 bytes are copied into a zero-padded buffer and parsed by the same code:
long tailLength = fileSize - tailStart;
MemorySegment tail = Arena.global().allocate(tailLength + 128); // zero-filled
MemorySegment.copy(file, tailStart, tail, 0, tailLength);
processFileRange(tail, 0, tailLength, stationTable);
It made no difference on 100M. On 1B the time went from 43.9s to 42.2s, which is likely run-to-run noise.
The reason is that the check was always true, so the branch predictor always got it right and it cost almost nothing. The profiler puts the time on the load because that’s where the CPU waits. Each line’s reads depend on where the previous line ended, and new pages cause page faults.
The lesson: a hot load means “waiting for data”, not “the read code is slow”. Removing predictable instructions that aren’t on that chain of dependent steps doesn’t save time.
Pass 8: Parallel chunks (1.7s → 0.5s)
Every profile so far shows one thread, main, mostly waiting on that chain of dependent loads, while 7 of the 8 cores sit idle.
So I split the file into line-aligned chunks and parsed them in a parallel IntStream. Each chunk gets its own StationTable, so there’s no sharing and no locks, and the tables are merged by station name at the end.
private static final int CHUNK_COUNT = Runtime.getRuntime().availableProcessors() * 16;

StationTable[] stationTables = new StationTable[CHUNK_COUNT];
long[] boundaries = splitFileIntoChunks(file, tailStart); // each boundary is a '\n'

IntStream.range(0, CHUNK_COUNT)
        .parallel()
        .forEach(i -> {
            long start = (i == 0) ? 0 : boundaries[i - 1] + 1;
            stationTables[i] = new StationTable();
            ChunkProcessor.processFileRange(file, start, boundaries[i] + 1, stationTables[i]);
        });

// merge
TreeMap<String, Entry> results = new TreeMap<>();
for (StationTable table : stationTables) {
    for (Entry entry : table.entries) {
        if (entry == null) continue;
        results.merge(new String(entry.nameBuffer, StandardCharsets.UTF_8), entry, Entry::merge);
    }
}
A few details:
- There are 128 chunks (8 cores × 16), not 8. The M1 Pro has 6 performance and 2 efficiency cores, so equal-sized chunks per core would leave the fast cores waiting on the slow ones. With many small chunks, the fast cores just take more of them.
- Reads may cross a chunk’s end by a few bytes. That’s harmless, because the mapping is read-only and the bytes past the end belong to the next line anyway.
- The merge walks 128 small tables of ~413 stations each, which is tiny next to the parse.
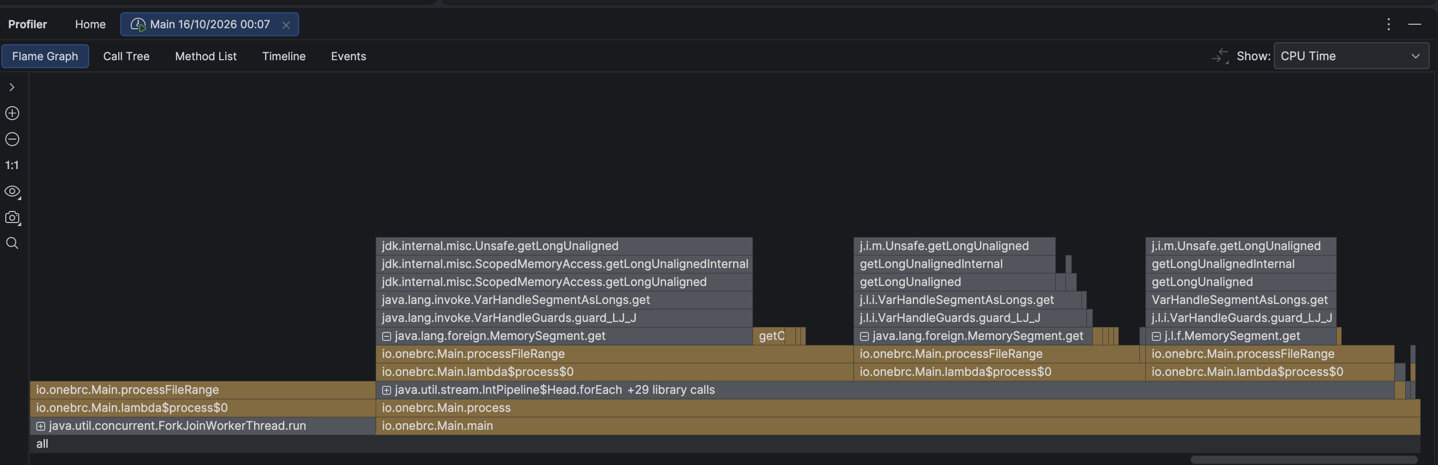
The work is now spread across ForkJoinWorkerThreads, and each one is still dominated by MemorySegment.get. On 1B the run took 13.5s, far from 10 × 0.5s, which fits the page-cache note in Setup.
What I took away
- Profile, change one thing, measure again. Every pass came from the previous flame graph, not from a list of known tricks. Several “obvious” wins (mmap, dropping the bound check) turned out much smaller than the profile suggested.
- A frame’s size is not the saving. When you remove a frame, the work it did often moves into new frames. Subtract all of them, then confirm with an end-to-end benchmark.
- A hot load is waiting, not slow code. Once the loop was tight, most of the time was the CPU waiting on memory. At that point, fewer instructions didn’t help and more cores did.
- Objects were the first big cost. Passes 1 to 3 cut the 1B time from 204.6s to 62.6s just by not creating a
String, aString[]or adoublefor every line.
The full code and the benchmark scripts are on GitHub. If you spot a mistake or have an idea for the next pass, feel free to leave a comment or contact me directly.
Leave a Comment